S&P 500 · 1-Month Horizon
Market-Implied Distribution
As of March 2, 2026
Expected Return
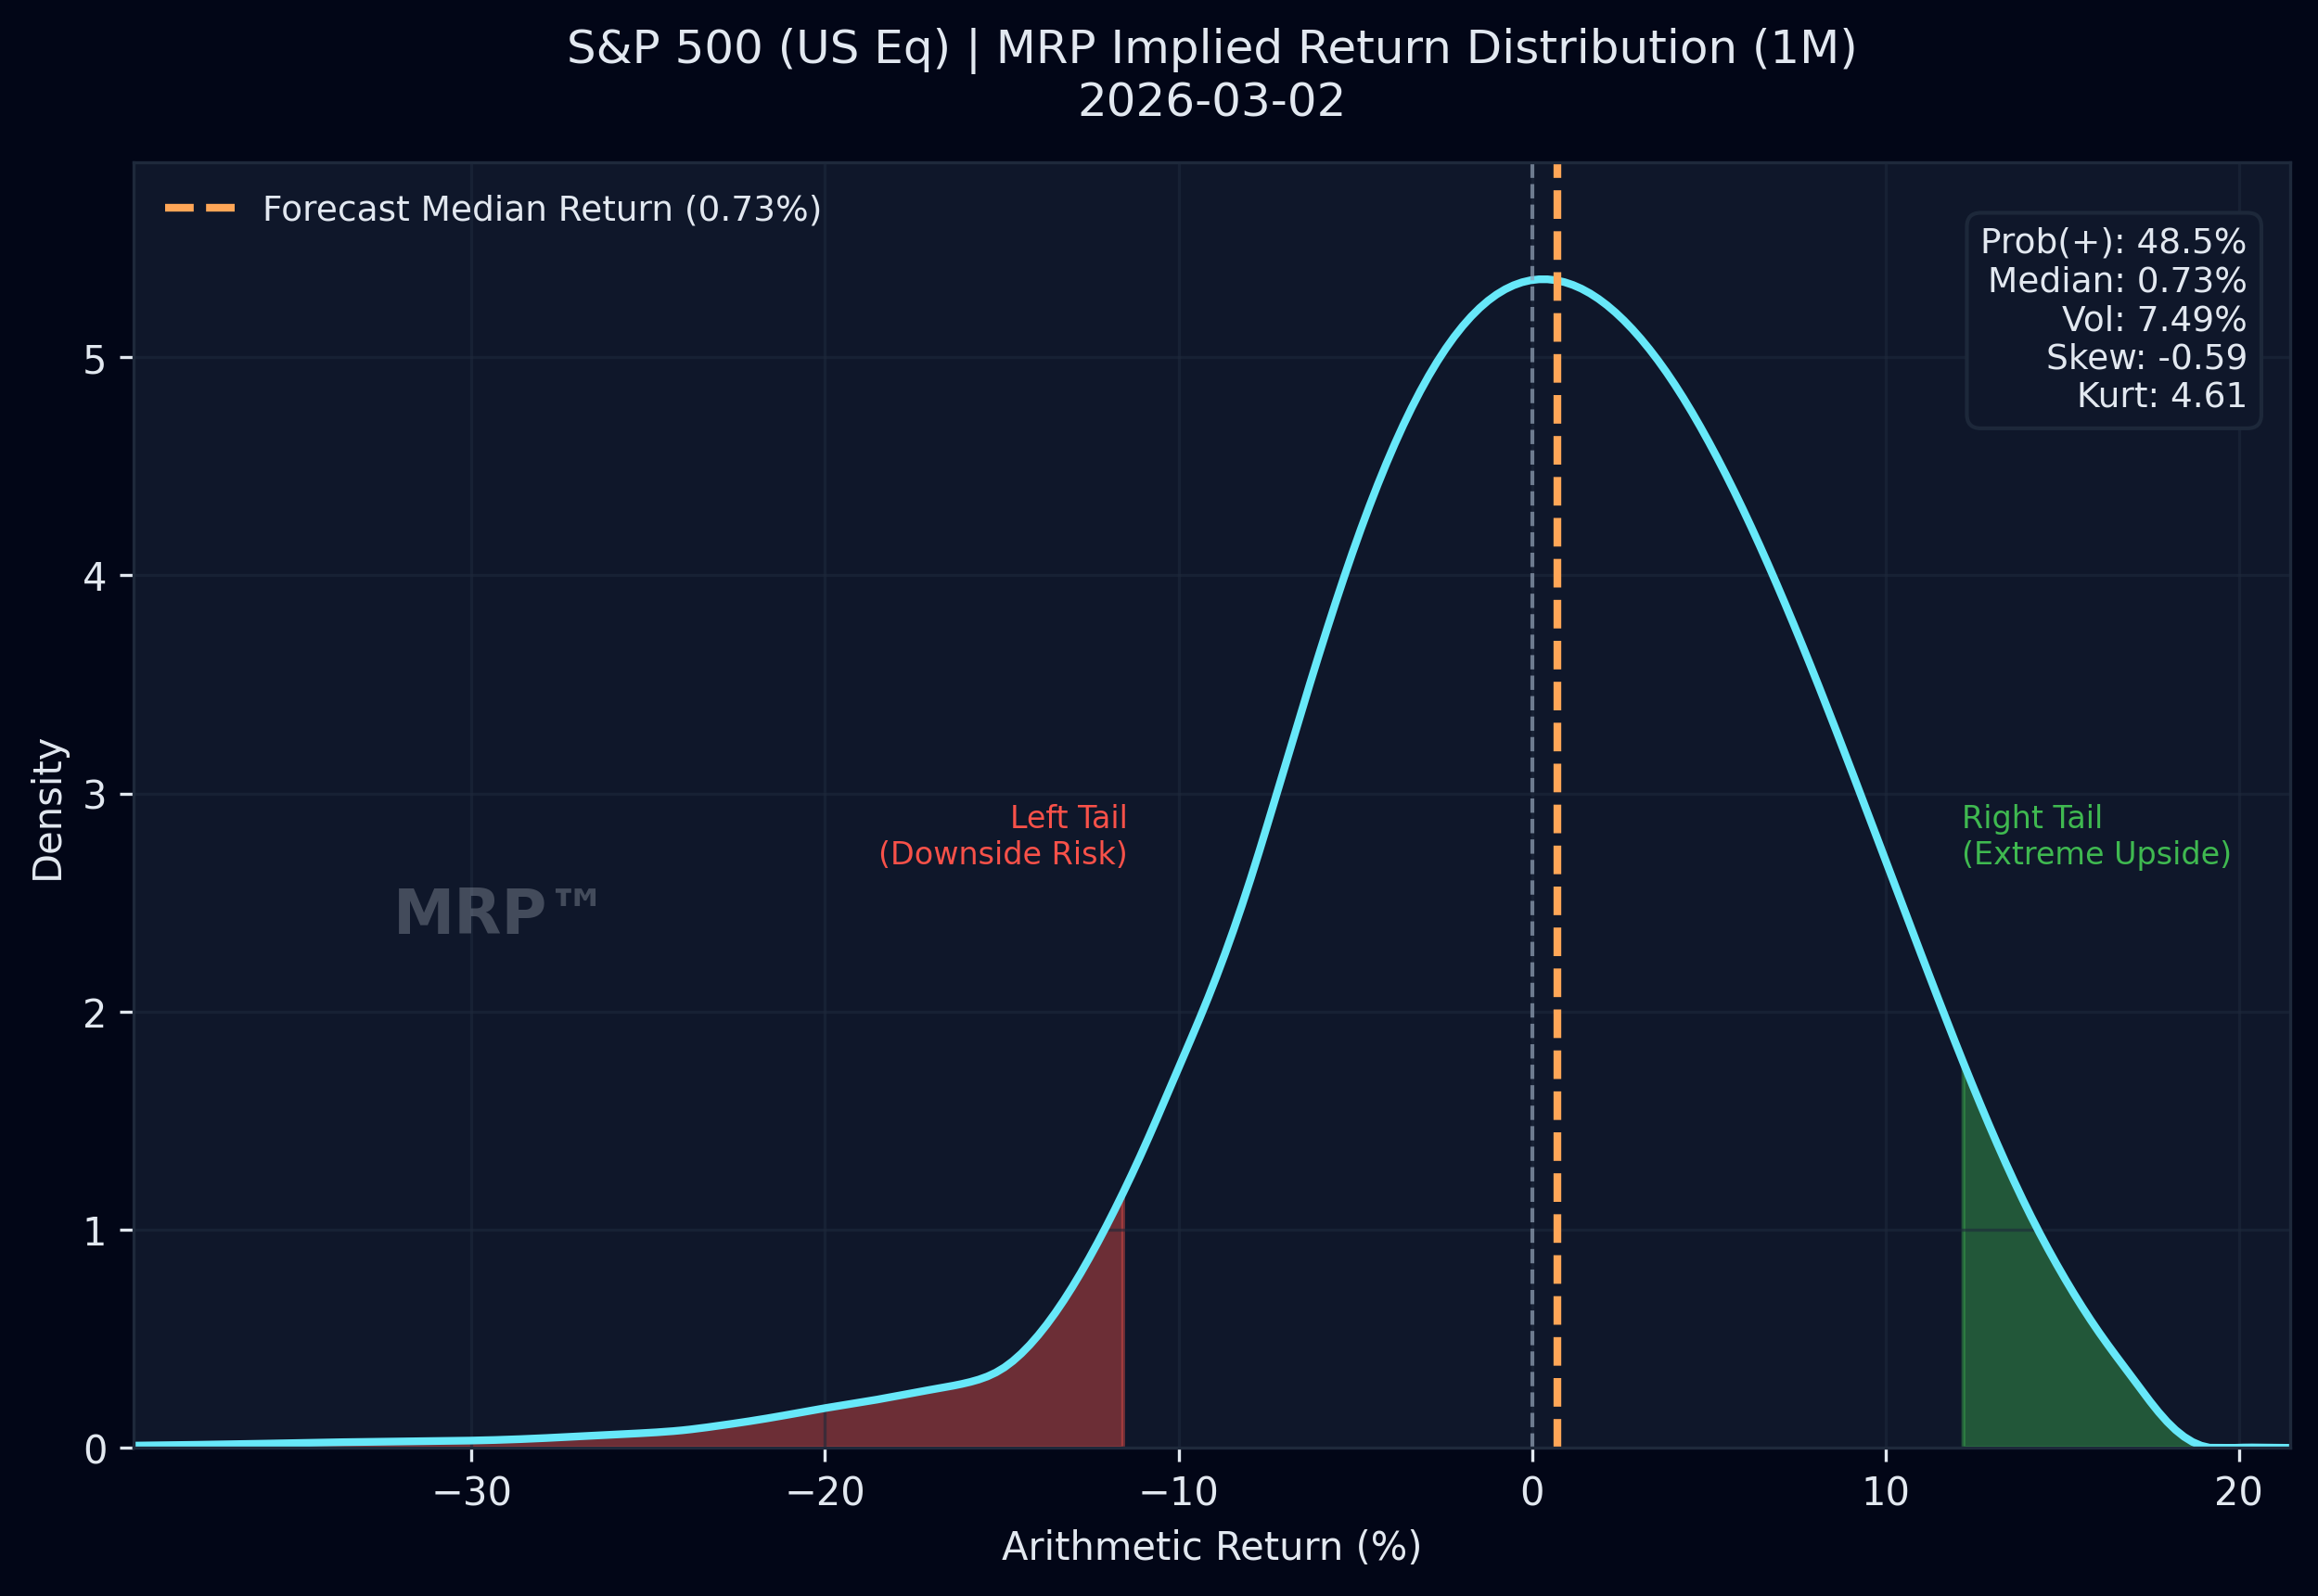
+0.73%
Positive market-implied median outcome
Probability of Gain
48.5%
Fewer than half of outcomes are positive
Skew
Negative
Downside asymmetry remains elevated
Tail Risk
Moderate
Tail losses are broadly in line with normal models
The current distribution shows a positive expected return for the S&P 500 over the next month, with 48.5% of the probability mass in positive territory. The negative skew and moderate tail risk indicate that the downside scenarios are materially larger in magnitude than the upside — a pattern worth weighing when considering position sizing and hedging.
Time Series
Distribution Parameter Monitor
The charts below track how the key parameters of the market-implied distribution have evolved over time — including expected return, probability of gain, skew, and tail behavior. Shifts in these parameters often provide early signals of regime change that variance-only frameworks do not capture.
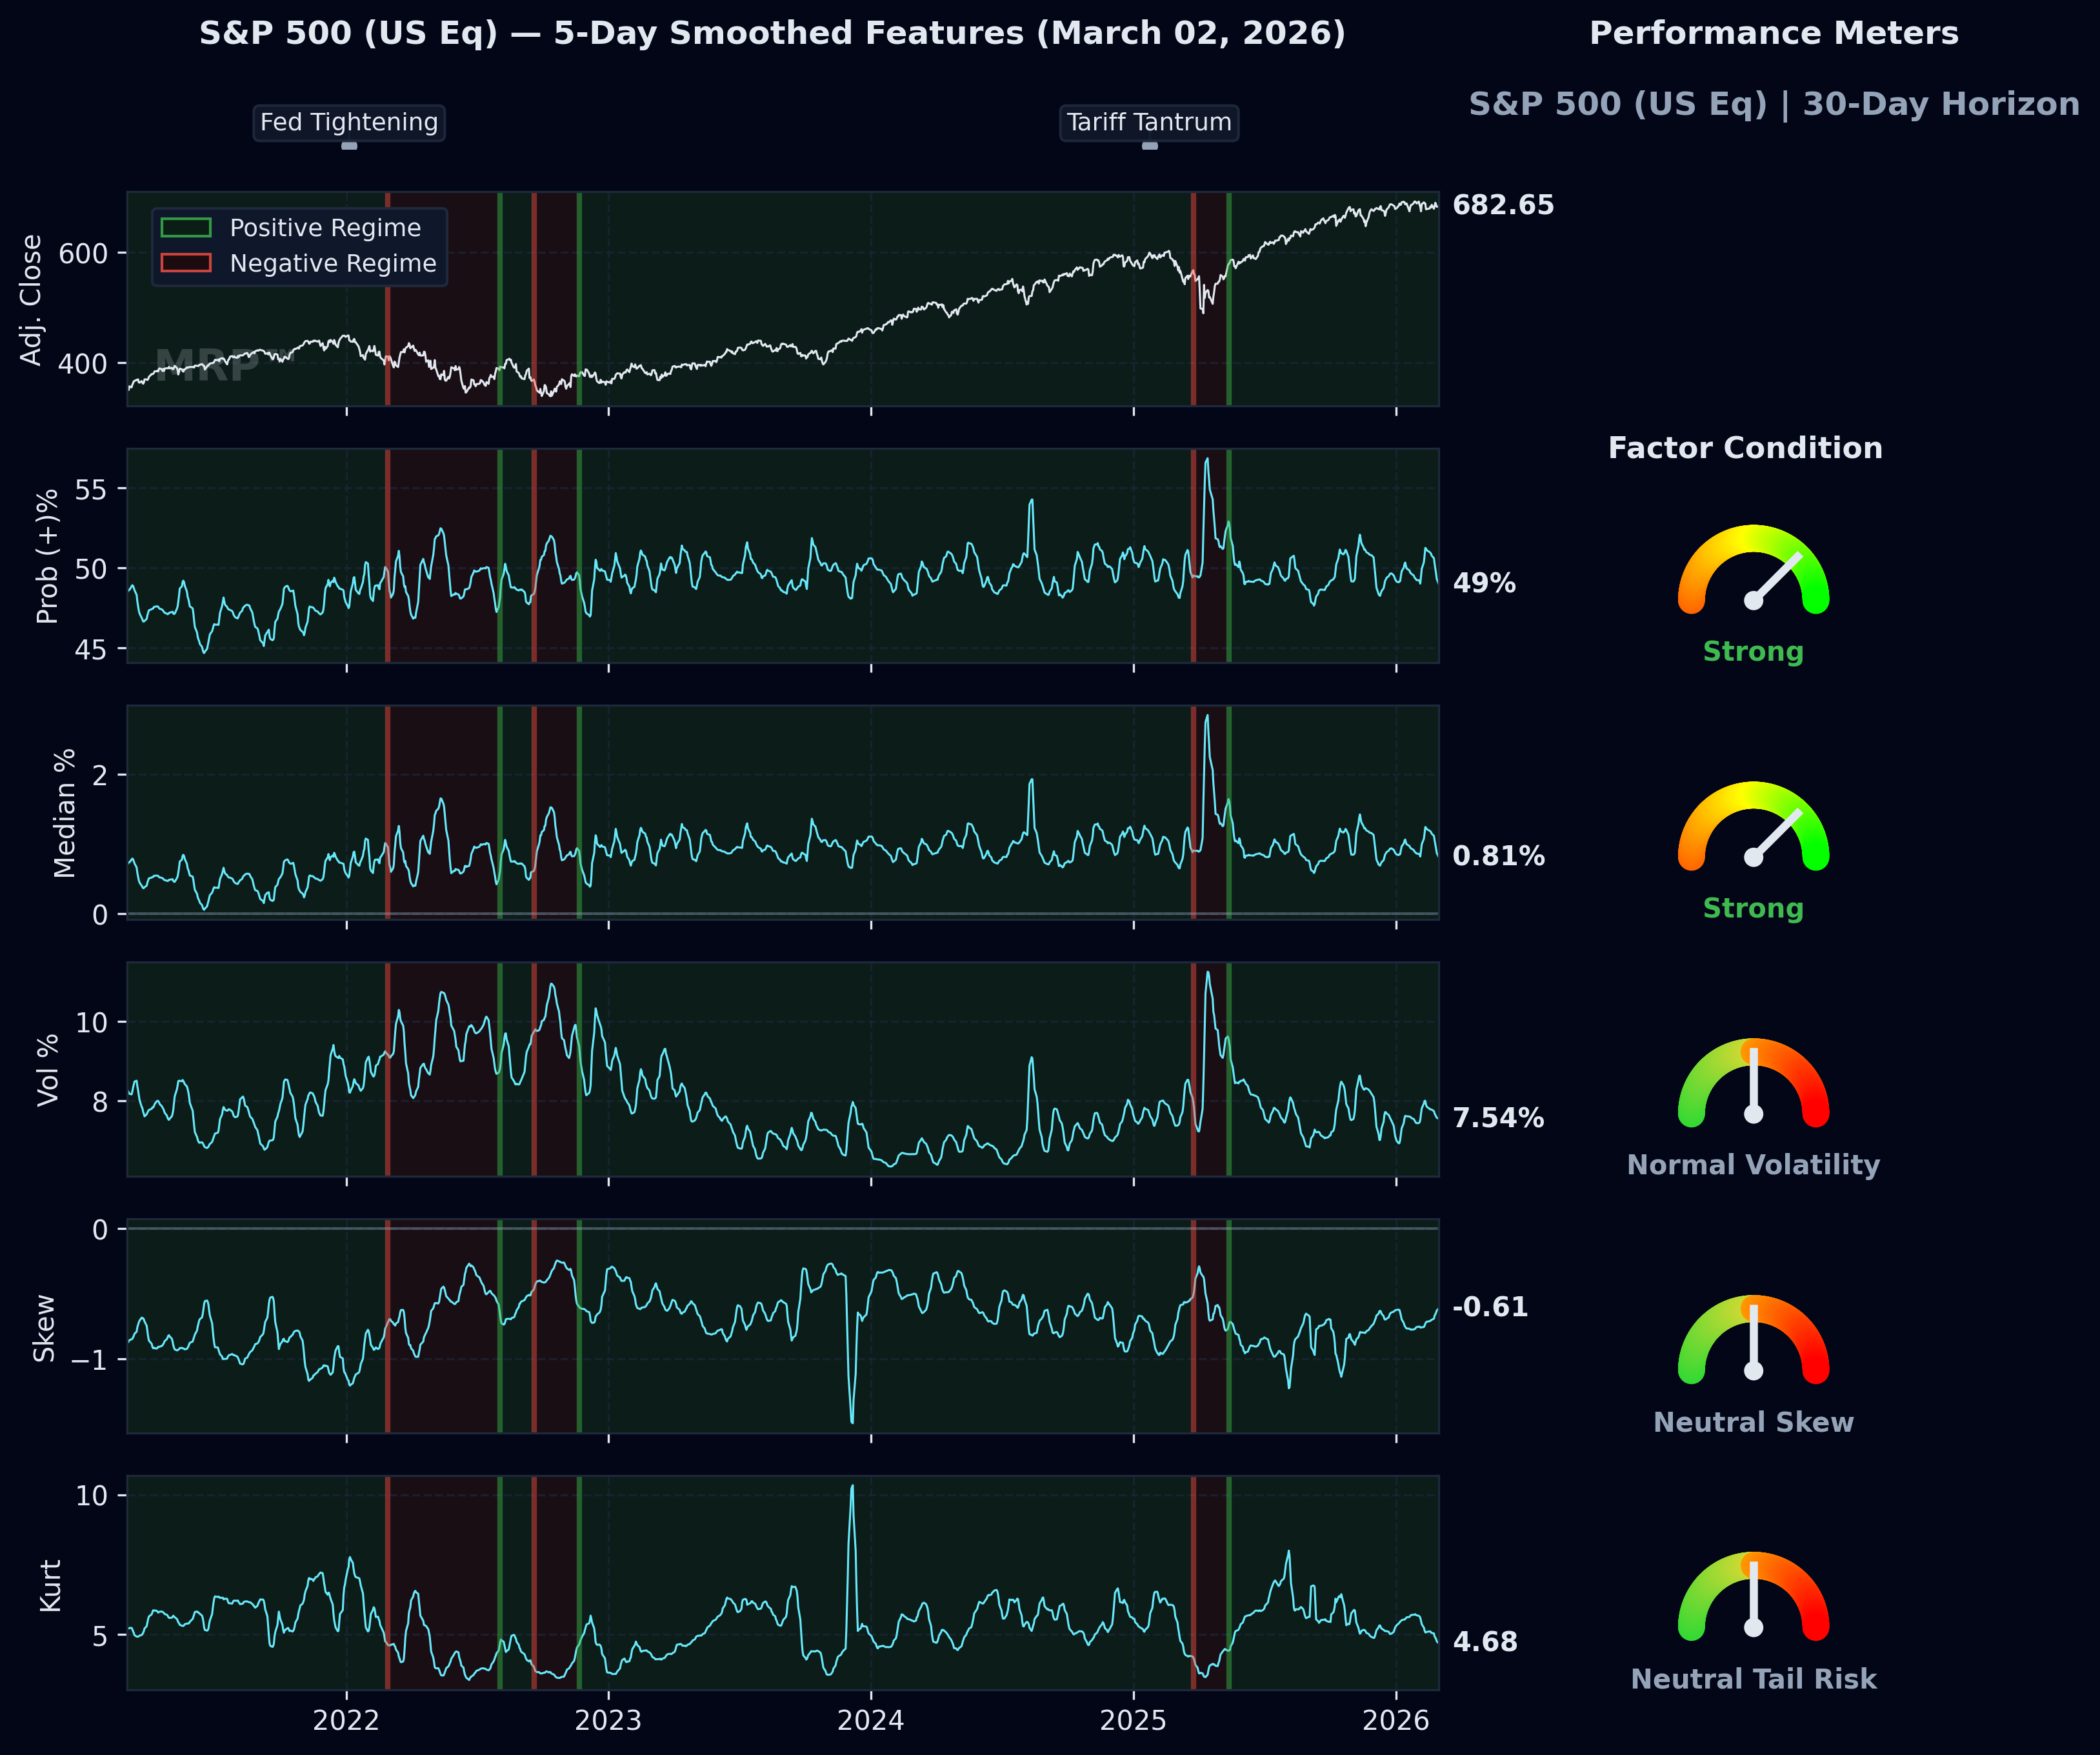
Parameter time series showing the evolution of market-implied distribution characteristics. Persistent deterioration in skew or a declining probability of gain can serve as early-warning indicators of a shifting risk environment.
Downloads
Available Reports
Full example reports are available below as PDFs. Each report opens in a new browser tab.